Nutrient omission plots
What is the Nutrient Omission Plot Technique
The omission plot technique is used to estimate fertilizer requirements. In an omission plot, adequate amounts of all nutrients are applied except for the nutrient of interest (the omitted nutrient). The yield in such an omission plot is related to the indigenous soil supplying capacity of the omitted nutrient. For example, if all nutrients except for Potassium (K) are applied in a K omission plot, the yield will be limited by the indigenous supply of K (that is K derived from soil, residue, organic materials, irrigation water, and sediment). The yield gap between a target yield and the yield in the omission plot is then used to calculate fertilizer requirements.
Omission plots make any nutrient limitations visible. Separate omission plots are needed for each nutrient. It is better to get a good yield average for each nutrient from several omission plots placed in a larger area than to use a single plot in one farmer's field.
How to use the omission plot technique
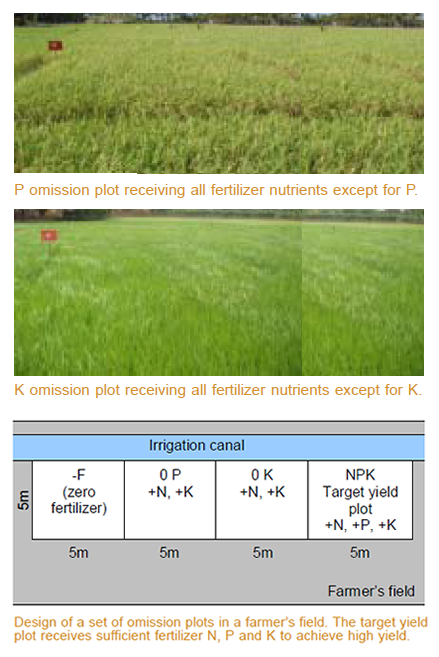
Omission plots are often used for major nutrients such as Nitrogen (N), Phosphorus (P) and Potassium (K) and should be installed in high-yielding seasons in farmers' fields. Use good-quality seed and follow proper crop management, including water and pest control. Select 10−20 representative farmers' fields for a larger area with similar soil conditions, and establish a 20 x 5 m plot in each farmer's field. Divide the plot into four 5 x 5 m omission plots (see drawing on opposite page). Bunds between plots should be 25 cm wide and 25 cm high to limit nutrient movement between plots.
-F |
The N-limited yield is measured in a minus fertilizer plot (-F) that should not receive any fertilizer N, P, or K. |
-P |
The P-limited yield is measured in a zero-P |
-K |
The K-limited yield is measured in a zero-K
|
NPK |
The yield without N, P, or K limitation is measured |
The rate of N and the splitting pattern for N fertilizer in the NPK plot can be determined through the use of the leaf color
chart (LCC). This same rate and timing of N should be used in the –P and –K plots. Apply Zn and other micronutrients to all plots, if deficiencies of these nutrients commonly occur at the site. At maturity, measure grain yield in a central 2 x 2.5 m area in each omission plot, the NPK target yield plot, and the farmer's practice (for comparison), and dry the grain in full sunlight for at least one whole day. Express grain yield in t/ha.
Fertilizer requirements
Calculate fertilizer requirements for N, P or K based on tables given in the Fact Sheets for Nitrogen, Phosphorus and Potassium.
Limitations of the technique
- A community or extension effort is needed to calculate fertilizer requirements.
- The estimation of indigenous nutrient supply using grain yield in omission plots is affected by crop management, adverse weather and/or pests damage.